It’s part and parcel of the sector we work in that there are a plethora of statistics out there about diversity and inclusion. The statistics are hard-hitting. They’re disappointing. Sadly, they’re not surprising.
As diversity recruiters, we come across statistics like these every single day. But through a lot of recent conversations with colleagues without a diversity and inclusion agenda, it’s clear to us that this data – and therefore the extent of the problem – is still largely unknown in the public eye. “Really? That doesn’t happen does it? In 2018?” is a common, naive response.
In this blog, we’ve gathered data on the impact that gender, ethnicity, neurodiversity, sexuality and social class has on the hiring process and in the workforce. Please tweet, pin and share these graphics so that more people can learn the statistical realities of being a ‘minority’ in the workplace.
The statistics are included both as graphics and as text, to assist people using screen readers. Sources are listed at the bottom of this article.
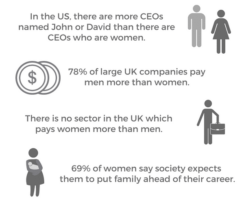
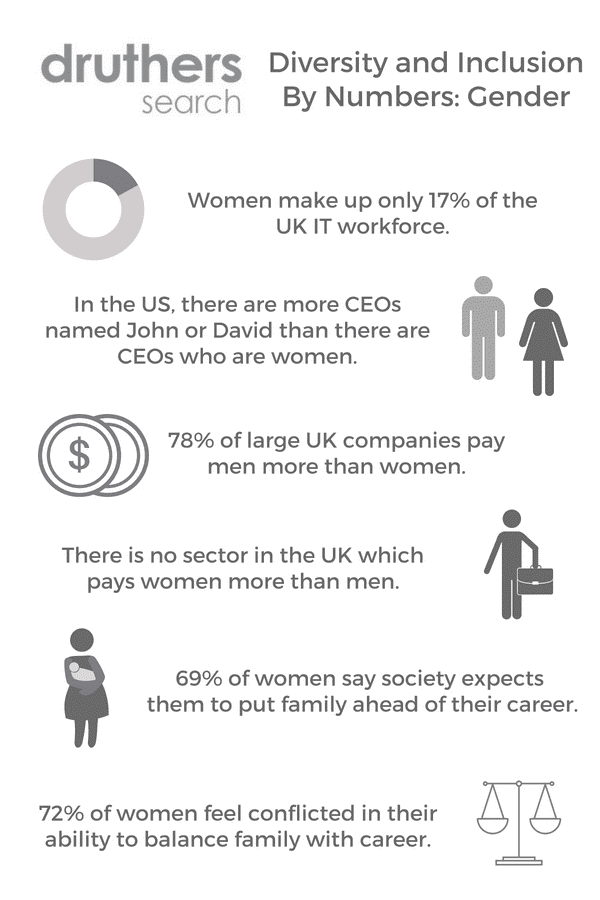
Diversity And Inclusion By Numbers: Gender
-
Women make up only 17% of the UK IT workforce.
-
In the US, there are more CEOs named John or David than there are CEOs who are women.
-
78% of large UK companies pay men more than women.
-
There is no sector in the UK which pays women more than men.
-
69% of women say society expects them to put family ahead of their career.
-
72% of women feel conflicted in their ability to balance family with career.
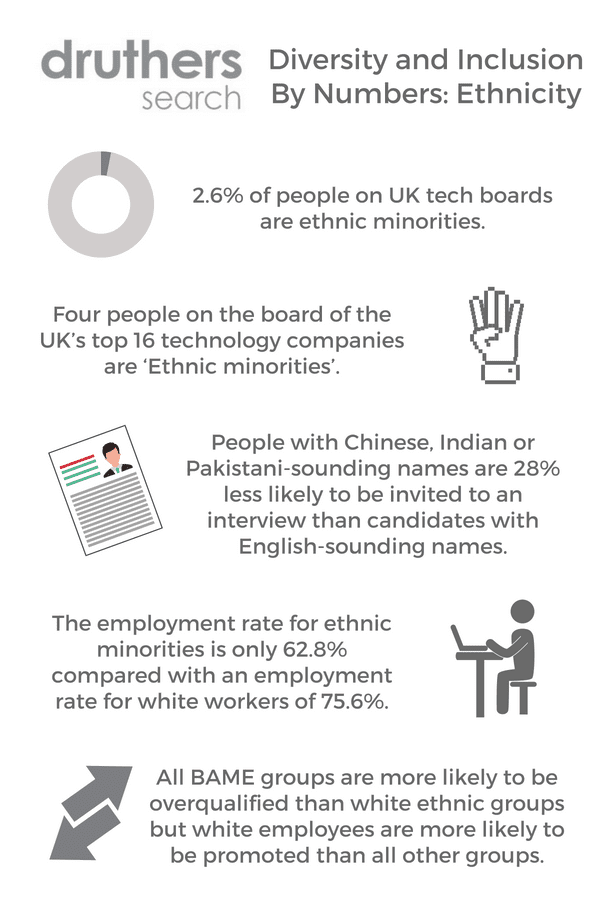
Diversity And Inclusion By Numbers: Ethnicity
-
2.6% of people on UK tech boards are ethnic minorities.
-
Four people on the board of the UK’s top 16 technology companies are ‘Ethnic minorities’.
-
People with Chinese, Indian or Pakistani-sounding names are 28% less likely to be invited to an interview than candidates with English-sounding names.
-
The employment rate for ethnic minorities is only 62.8% compared with an employment rate for white workers of 75.6%.
-
All BAME groups are more likely to be overqualified than white ethnic groups but white employees are more likely to be promoted than all other groups.
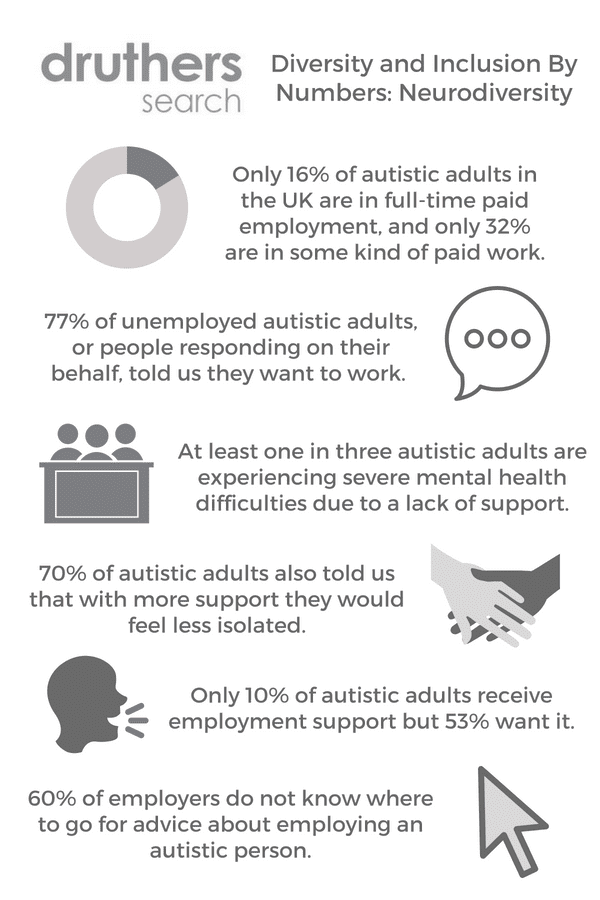
Diversity And Inclusion By Numbers: Neurodiversity
-
Only 16% of autistic adults in the UK are in full-time paid employment, and only 32% are in some kind of paid work.
-
77% of unemployed autistic adults, or people responding on their behalf, told us they want to work.
-
At least one in three autistic adults are experiencing severe mental health difficulties due to a lack of support.
-
70% of autistic adults also told us that with more support they would feel less isolated.
-
Only 10% of autistic adults receive employment support but 53% want it.
-
60% of employers do not know where to go for advice about employing an autistic person.
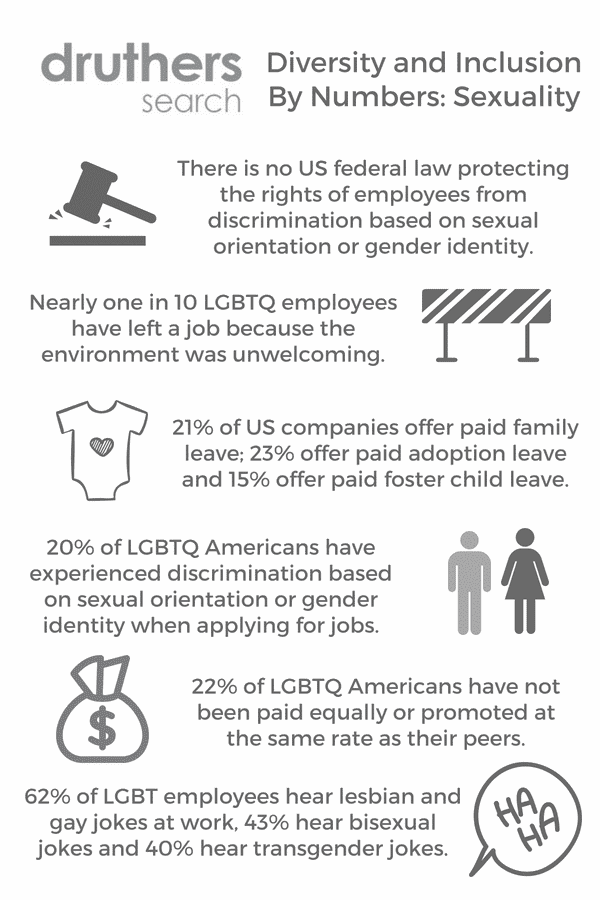
Diversity And Inclusion By Numbers: Sexuality
-
There is no federal law protecting the rights of employees from discrimination based on sexual orientation or gender identity in the US.
-
Nearly one in 10 LGBTQ employees have left a job because the environment was unwelcoming.
-
21% of US companies offer paid family leave; 23% offer paid adoption leave and 15% offer paid foster child leave.
-
20% of LGBTQ Americans have experienced discrimination based on sexual orientation or gender identity when applying for jobs.
-
22% of LGBTQ Americans have not been paid equally or promoted at the same rate as their peers.
-
62% of LGBT employees hear lesbian and gay jokes at work, 43% hear bisexual jokes and 40% hear transgender jokes.
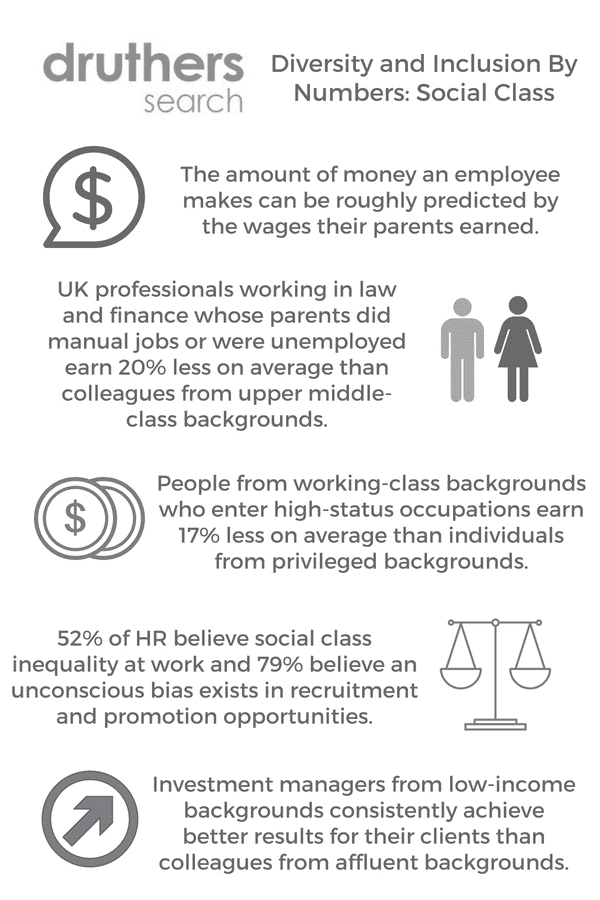
Diversity And Inclusion By Numbers: Social Class
-
The amount of money an employee makes can be roughly predicted by the wages their parents earned.
-
UK professionals working in law, accountancy and finance whose parents did manual jobs or were unemployed earn 20% less on average than colleagues from upper middle-class backgrounds.
-
People from working-class backgrounds who enter high-status occupations earn 17% less on average than individuals from privileged backgrounds.
-
52% of HR professionals believe social class inequality occurs in the workplace and 79% believe an unconscious bias exists in recruitment and promotion opportunities.
-
Investment managers from low-income backgrounds consistently achieve better results for their clients than colleagues from affluent backgrounds.
Sources
https://gender.bitc.org.uk/all-resources/factsheets/women-and-work-facts
https://www.weforum.org/agenda/2017/05/job-applications-resume-cv-name-descrimination/
https://www.allaboutcareers.com/features/article/does-class-discrimination-exist-in-the-jobs-market
https://www.autism.org.uk/about/what-is/myths-facts-stats.aspx
https://www.autism.org.uk/get-involved/tmi/employment.aspx
https://www.catalyst.org/knowledge/lesbian-gay-bisexual-transgender-workplace-issues
http://outandequal.org/2017-workplace-equality-fact-sheet/
https://www.ft.com/content/8001d074-dcc9-11e6-86ac-f253db7791c6
http://journals.sagepub.com/doi/abs/10.1177/0003122416653602


